Mastering GemPages Sales Funnel Statistics: Key Metrics for Boosting Your Upsell Strategy

In the competitive eCommerce landscape, optimizing upsell strategies is essential for maximizing revenue and improving customer experiences.
Sales Funnel statistics play a critical role in this optimization process, offering insights into how post-purchase offers are performing.
For example, you have an offer to sell a shirt and it brings in 120 visits, 45% conversion rate, revenue increases 54%, surely you will decide to spend more money to run ads for this offer.
However, many businesses struggle with fully grasping these metrics and leveraging them effectively.
To better serve Shopify merchants, GemPages has not only launched the Sale Funnels feature to support the full customer journey but is now also introducing its advanced capability: measuring the effectiveness of sales funnel.
This article will explain the data that our reports provide so as for customers to understand the meaning and impact of these numbers on your business campaign.
Important note: Starting 01 February, 2025, a commission fee will be applied to Optimize Plan users who take advantage of the Sales Funnel feature. Every $1000 increment in revenue, users will be charge $10. For more detail, check it out on our pricing plans.
Let’s first answer the question:
What is Sales Funnel Statistics?
Sales Funnel statistics refer to the detailed data collected through a selling funnel system that tracks and reports on the performance of post-purchase offers.
Unlike general sales reports, which provide a broad view of revenue, Sales Funnel statistics focus specifically on the efficacy of post-purchase upsell and cross-sell offers.
The interesting thing?
GemPages' native Sales Funnels Report System nailed it with the comprehensive insights and exceptional abilities off:
- Eliminating the need for external reporting tools, such as Google Analytics.
- Allowing businesses to monitor key metrics related to post-purchase offers
- Ensuring a data-driven approach to decision-making
Understanding our report helps businesses fine-tune their upsell strategies, ultimately leading to better performance and increased revenue.
Learn more: Testing GemPages Sales Funnel Upsell with Shopify Orders
Detailed Explanation of Each Metric
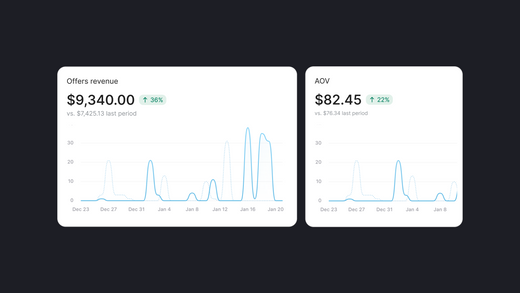
All GemPages Sales Funnel data reports are seamlessly built-in, offering in-depth insights into Post-purchase Offer performance with key metrics including:
|
Key metrics |
Note |
How it works |
|
1.Visits Offer |
The number of unique visits to offer pages of a funnel |
In the funnel, every time an order is successfully checked out, an upsell offer page will appear for the customer to see, and will be counted as 1 unique visit |
|
2. Accepted Offers |
Total accepted offers of a funnel |
When a customer successfully purchases an upsell offer, it will be counted as 1 accepted offer. Note: A unique visitor can accept multiple upsell offers in a funnel, but it will be counted as just one accepted offer. |
|
3. Conversion Rate (CR) |
Percentage of accepted offers, out of the total number of visit offers. |
CR = (Accepted offers/visits offer) * 100 |
|
4. Orders Revenue |
Total gross sales of orders generated from a funnel |
Total money of the first product + upsell/down sell products in a funnel |
|
5. Average Order Value (AOV) |
Orders revenue divided by the number of orders generated from a funnel |
AOV = Orders revenue / number of orders in a funnel |
|
6. Offers Revenue (OR) |
The increase of orders revenue, from upsell and downsell offers of this funnel. |
OR = upsell offers + down sell offer in a funnel |
How to view your report on the dashboard
Step 1: Log into your GemPages Dashboard, on the left side bar, click Sales Funnels, all of the data will be shown on the screen. These are the data of all activated funnels.
 These are the datas of all your activated funnels.
Step 2: Scroll down a little bit, you will see your Funnel List. Select one to see detailed data.
 Select a funnel to see the detailed data.
Here is your full screen showing all the information:
 From now on, you can master your sales funnel by owning the detailed data.

Conclusion
Understanding and utilizing Sales Funnel statistics is crucial for optimizing your marketing efforts and boosting conversions. Regular analysis of these metrics allows you to refine your upsell strategies, identify successful tactics, and uncover areas for improvement.
According to our internal statistics, some customers have achieved up to 18% upsell conversion rate, which is quite impressive; besides, some customers who have just used GemPages Sales Funnels have earned nearly $1000 in just 2 weeks from their first few upsells. These numbers cannot deny the power and capabilities that GemPages Sales funnel brings.
GemPages believes that the system will help customers upsell even more, and we will also update upsell strategies, tips, and practical case studies soon.
Find out more on Sales Funnel with us from GemPages Blog


 Facebook Community
 Change Log
 Help Center


